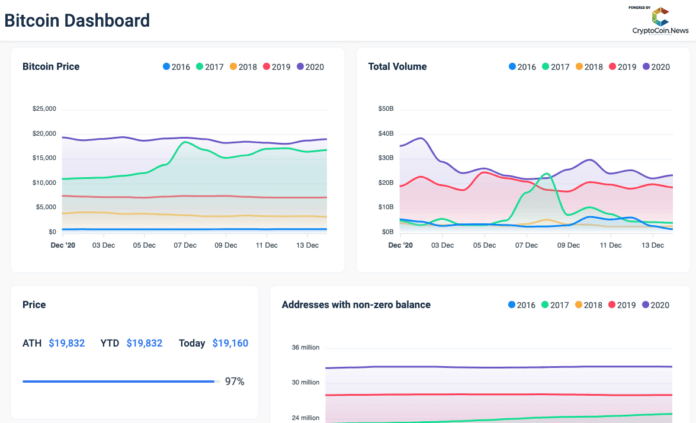
- Bitcoin Dashboard offers users a quick and easy insight into BTC’s historic and current performance.
- The platform offers simple charts and graphs to keep track of BTC and compare its positions in the last 5 years.
- Bitcoin Dashboard also offers insight into BTC mining and even a quick breakdown of where people store their coins.
Bitcoin (BTC) price has surged strongly in 2020, particularly over the last few months. Only days ago, it even reached a new all-time high, although it only went slightly beyond its ATH from 2017, and it still didn’t actually touch $20,000. But, many assume that this is only a matter of time, and with all of the attention being on Bitcoin — Bitcoin Dashboard made it easy for traders, investors, analysts, and others to access and quickly compare historic BTC prices.
What Does Bitcoin Dashboard Offer?
Bitcoin Dashboard is a platform that offers insight into the historic price, volume, and other details regarding Bitcoin and its position in the crypto industry.
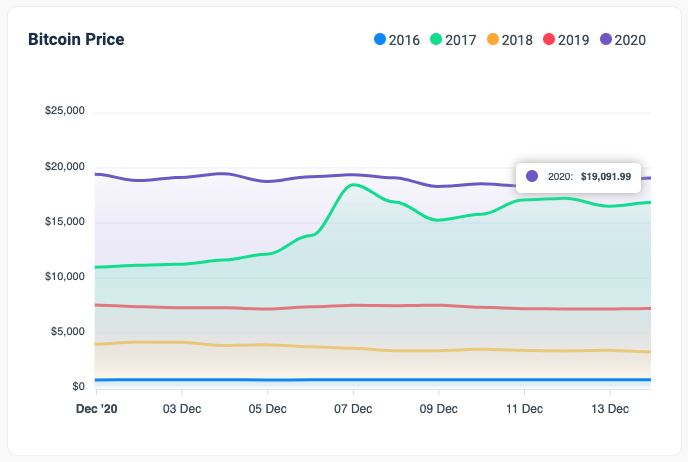
The platform is very clean and easy to read and understand, even for novices. It offers charts and graphs that can show you exactly where BTC price was in the last five separate years.
So, at the time of writing, (December 14th, 2020) BTC price sits at $19,091 — once again rising after the last week’s dip. On this exact day last year, the coin’s price stood at $7,236. A year before that, in 2018, BTC had a price of only $3,300 on this day. In 2017, the coin’s price was much closer to its current heights, sitting at $16,865. Finally, in 2016, BTC was only worth $775.

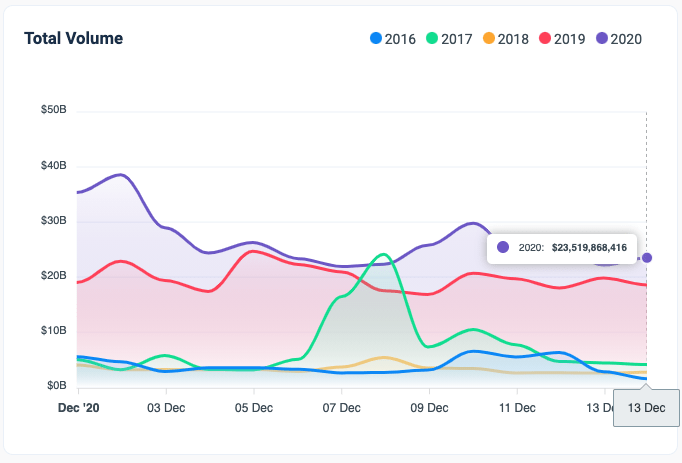
Of course, the platform offers insight into more than just the BTC price. Users can also check out the coin’s volume over time, which clearly indicates that BTC has been traded the most in 2020, with one small exception on December 7th, where its record volume is still held by 2017.
Despite the fact that the coin’s price was lower in 2019 than in 2017, however, both 2019 and 2020 dominate in terms of volume.

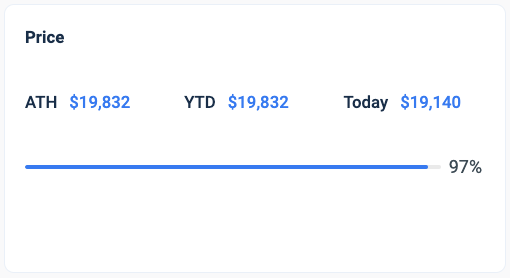
Next, Bitcoin Dashboard offers an easy way to see BTC’s all-time high (ATH), and its YTD record price. Coincidentally, right now, the coin’s ATH and YTD are the same, since BTC made a new ATH only days ago. The same information is offered to compare the ATH and YTD of the coin’s market cap.

Other Details About Bitcoin
Lastly, Bitcoin Dashboard also offers some information about BTC mining, exchange dominance, and a breakdown of exchanges’ ownership of BTC.
When it comes to Bitcoin mining, there is a simple enough graph that shows that 88.4% of the coin has already been mined. In other words, only 11.6% remains at the time of writing. In terms of exchange dominance, the large majority of Bitcoin is currently stored out of exchanges, in private or custody wallets — 87.1%.
The amount that does sit in exchanges is only 12.9% of the coin’s circulating supply. Out of that 12,9% that are stored within exchanges, 37.3% sits within Coinbase, making it the largest holder of BTC in the industry.

Other exchange giants hold significantly smaller amounts. Binance, for example, only has 12.2% of all BTC stored within exchanges, while OKEx holds 8.4%. 8% sits in Huobi’s wallets, and as much as 34.2% is stored within other platforms.


